The Burrill Report
|
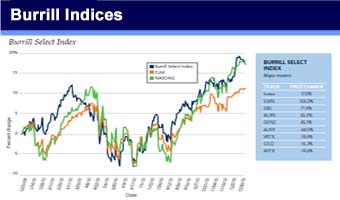
BURRILL INDICES
|
12/31/12
|
9/27/13
|
10/4/13
|
Week Change
|
Year Change
|
| Burrill Select |
589.98 |
907.95 |
900.89 |
-0.78% |
52.70% |
| Burrill Large-Cap |
711.61 |
1127.72 |
1123.66 |
-0.36% |
57.90% |
| Burrill Mid-Cap |
309.52 |
492.25 |
496.78 |
0.92% |
60.50% |
| Burrill Small-Cap |
105.48 |
159.18 |
155.67 |
-2.21% |
47.58% |
| Burrill Diagnostics |
191.32 |
215.57 |
215.90 |
0.15% |
12.85% |
| Burrill Personalized Medicine |
118.52 |
151.11 |
149.14 |
-1.31% |
25.83% |
| Burrill Biogreentech |
163.09 |
184.66 |
183.05 |
-0.87% |
12.24% |
| NASDAQ |
3019.51 |
3781.59 |
3807.75 |
0.69% |
26.10% |
| DJIA |
13104.14 |
15258.24 |
15072.58 |
-1.22% |
15.02% |
| S&P 500 |
1426.19 |
1691.75 |
1690.50 |
-0.07% |
18.53% |
| Amex Biotech |
1547.03 |
2195.15 |
2206.93 |
0.54% |
42.66% |
| Amex Pharmaceutical |
369.57 |
431.32 |
432.62 |
0.30% |
17.06% |
| NASDAQ Biotechnology Index |
1430.81 |
2201.67 |
2219.23 |
0.80% |
55.10% |
|
Note: The annual rebalancing of the Burrill Indices took place on October 1, 2013.
June 10, 2013
http://www.burrillreport.com/article-burrill_company_indices.html 


.gif)